What drives the GCB market?
By Alan Cheong
/ Savills |

While the rest of the economy laboured under the yoke of slowing global growth, competition from disruptive technologies and a slew of cooling measures, the oil and gas (O&G), and offshore and marine (O&M) industries had their day in the sun. That was until oil prices started to tip over in October 2014. From then on, things never looked the same — not only for those in the industry but also for corporate and enterprise bankers as well.
The Good Class Bungalow market had a strong run until 2015 compared with non-landed properties, which saw prices moderating in 2H2013 (see Chart 1). All this appears to be connected with the vicissitudes of the fortunes of players in the O&G and O&M industries, which saw oil prices starting to slide as early as June 2015 before plunging in the fourth quarter of that year.
When one compares the price of oil to the price of GCB land, there appears to be a lag effect of one year for the latter to react on the downside (see Chart 2).
Chart 1
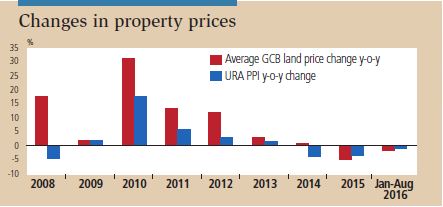
Source: REALIS, Savills Research & Consultancy
Chart 2
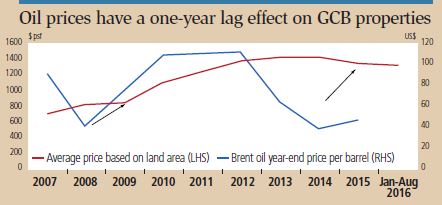
Source: REALIS, Savills Research & Consultancy
However, cross-checking GCB transactions captured by Realis for the January-to-July 2016 period with an agent who specialises in this segment of the landed residential market did not flag up any known sales by owners from the O&G and O&M sectors. Thus, a preliminary case may be made that the weakness in the GCB market may not be due to sales by those exposed to the two sectors. What could be the reasons then for the drop in prices?
--thisisapagebreak
Weak economy
For one, the economy has been weak and Chart 3 shows that the correlation between the total transaction value of GCBs and GDP growth is strong. This sends the message that the GCB market may not be that much affected by the O&G and O&M sectors, or even if it is, the impact is indirect, via the GDP. Our fixation with trying to lock on to who in the two sectors is trying to sell, or has sold, his house could have led us on a wild goose chase to try and find that link when, in fact, that nexus is at best tenuous.
Chart 3
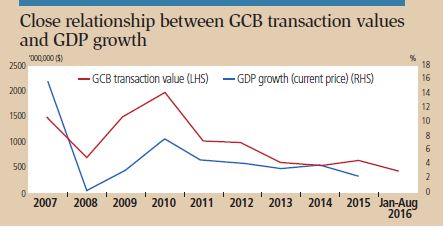
Source: REALIS, Savills Research & Consultancy
What this tells us is that the recovery in the GCB market is more closely linked to the overall well-being of our economy. There is, however, an unusual correlation between this segment of the market and the Gini coefficient. The Gini coefficient is a measure of statistical dispersion intended to represent the income distribution of a nation’s residents, and is the most commonly used measure of inequality. Seemingly innocuous, this measure of income inequality does appear to have an impact on transaction numbers.
Chart 4 shows that the total transacted value of GCBs appear to be quite closely linked to the Gini coefficient, with an improving income equality seemingly forcing the number of GCB transactions down. Although it may be easier to explain why a worsening Gini coefficient is linked to more GCBs being transacted (since if income inequality worsens, it implies that the rich are getting even richer, which then correlates with GCB prices and transactions), it is harder to explain the case when the former is improving and fewer bungalows are sold. Although one explanation could be that the relationship is spurious, another could be that when the economy is slowing down, GCB owners still have strong holding power, resulting in fewer units being sold at less than optimal prices.
Chart 4
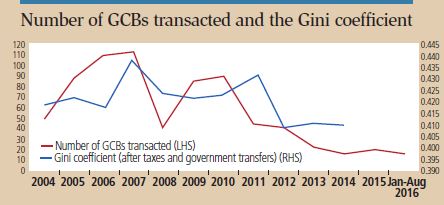
Source: REALIS, Savills Research & Consultancy
This then brings us to the next point: the sensitivity of GCB prices compared with other types of private residential properties. For this, we use the beta, which, for a reading above 1 means that the price of a particular type of property is more accentuated than the overall URA Property Price Index (PPI). From 1990 to end-2014, the last available date that URA supplied indices for these sub-segments of the residential market, the beta for condominiums was 0.91, while that of terraced and semi-detached houses was 1.12 and 0.08 respectively. For GCBs, for the period from 2000 to 2Q2016, the beta was a whopping 2.56.
This is something that cannot be overstated because it can be used to time an investment of a GCB. Chart 5 shows how the polynomial (degree 2) curve of GCB prices behaved from 1Q2010 to 2Q2016. Comparing this with the URA PPI, one would find that bungalow prices outperform on the upside and similarly over-correct on the downside. From the start of 2010 to the curve’s peak in 4Q2013, prices rose about 51%. In contrast, the URA PPI increased just around 23%. During the downturn, while the URA PPI fell 9.4%, the GCB price curve fell 15.1%. In short, for the period of analysis, on the upside, GCB prices rose 2.2 times more than the URA PPI, while on the downside, they fell 1.6 times more.
Chart 5
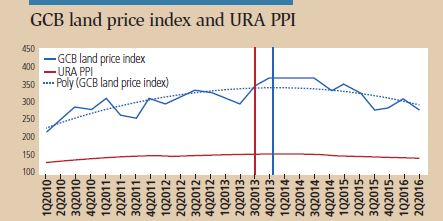
Source: REALIS, Savills Research & Consultancy
--thisisapagebreak
This asymmetrical price performance adds further insights to the purchase decision in that while it may be the case that transaction volumes fall when economic growth slows, prices may not fall as much as they had risen when times were good. And although the measure of income inequality has improved, the owners of GCBs generally have strong holding power in that transaction volumes almost dry up during trying economic times. In 2012, there were 37,873 transactions in the new and resale market for all private residential properties, while there were just 39 GCB transactions. In 2015, the number of new and resale transactions for private residential properties fell to 14,117 units, or down 62.8%. For GCBs, the number of caveats lodged in 2015 was 21, representing a decline of 46.1%.
Therefore, not only in percentage but also in pure numerical terms, owners of GCBs appear to have stronger holding power than those in the broader private residential market. This means that buying a GCB at the right point in time would reap handsome rewards price-wise when the market rises. On the downside, although prices fall faster than the URA PPI, the net gain for a GCB today compared with prices in 1Q2010 is 29%, far superior to the 11.9% recorded for the URA PPI.
Conclusion
A GCB is a unique asset class as it exhibits superior price performance on the upside, and although it tends to react more to negative movement in overall private residential prices, the fact of the matter is that on the downside, transaction volumes dry up, signifying that owners have strong holding power. The behaviour of this segment of the residential market is probably not surprising as the owners of GCBs have not only wealth but also connections to enhance their status.
As for the outlook of the GCB market, with prices having fallen 15.1% from mid-2013 to mid-2016, more than the 9.4% recorded for the general private residential market, if one takes the view that the latter has stabilised and is starting its journey into the next phase of the property cycle, then GCB prices should start reacting on the upside very soon. For now, what could be retarding GCB prices is the slow economy, but that could only be for a very short period, for there is no lack of the wealthy waiting on the sidelines to add to their collection of such a prized asset.
Alan Cheong is head of research and consultancy at Savills Singapore
This article appeared in The Edge Property Pullout, Issue 746 (Sep 19, 2016) of The Edge Singapore.

Follow Us
Follow our channels to receive property news updates 24/7 round the clock.
Subscribe to our newsletter
Search Articles